
We're looking into how the Superchain has evolved during the last five months.
In November 2024, the ProbeLab team ran an analysis on the Optimism network (OP Stack Chain ID 10). The results were reported in this blogpost: https://www.probelab.network/blog/optimism-chain-composition. We repeated the study in mid March 2025 to see how the Optimism network evolved during this period. Here’s the most important results.
There seems to be a remarkable increase in the size of the network since November 2024, when the total number of nodes seen was 3,770. In March 2025 the total number of nodes has more than tripled and reached 13,131!
The distribution of nodes by Chain ID, building on the OP Stack Chain ID on the discv5 network together with the count difference to the previous study is as shown below.

A couple of items stand out:
We’ve looked into the geographic distribution of nodes both in terms of continent and in terms of country. Europe seems to have increased its dominance with regard to the number of nodes deployed within its boarders with Germany being by far the country with the most Superchain nodes.
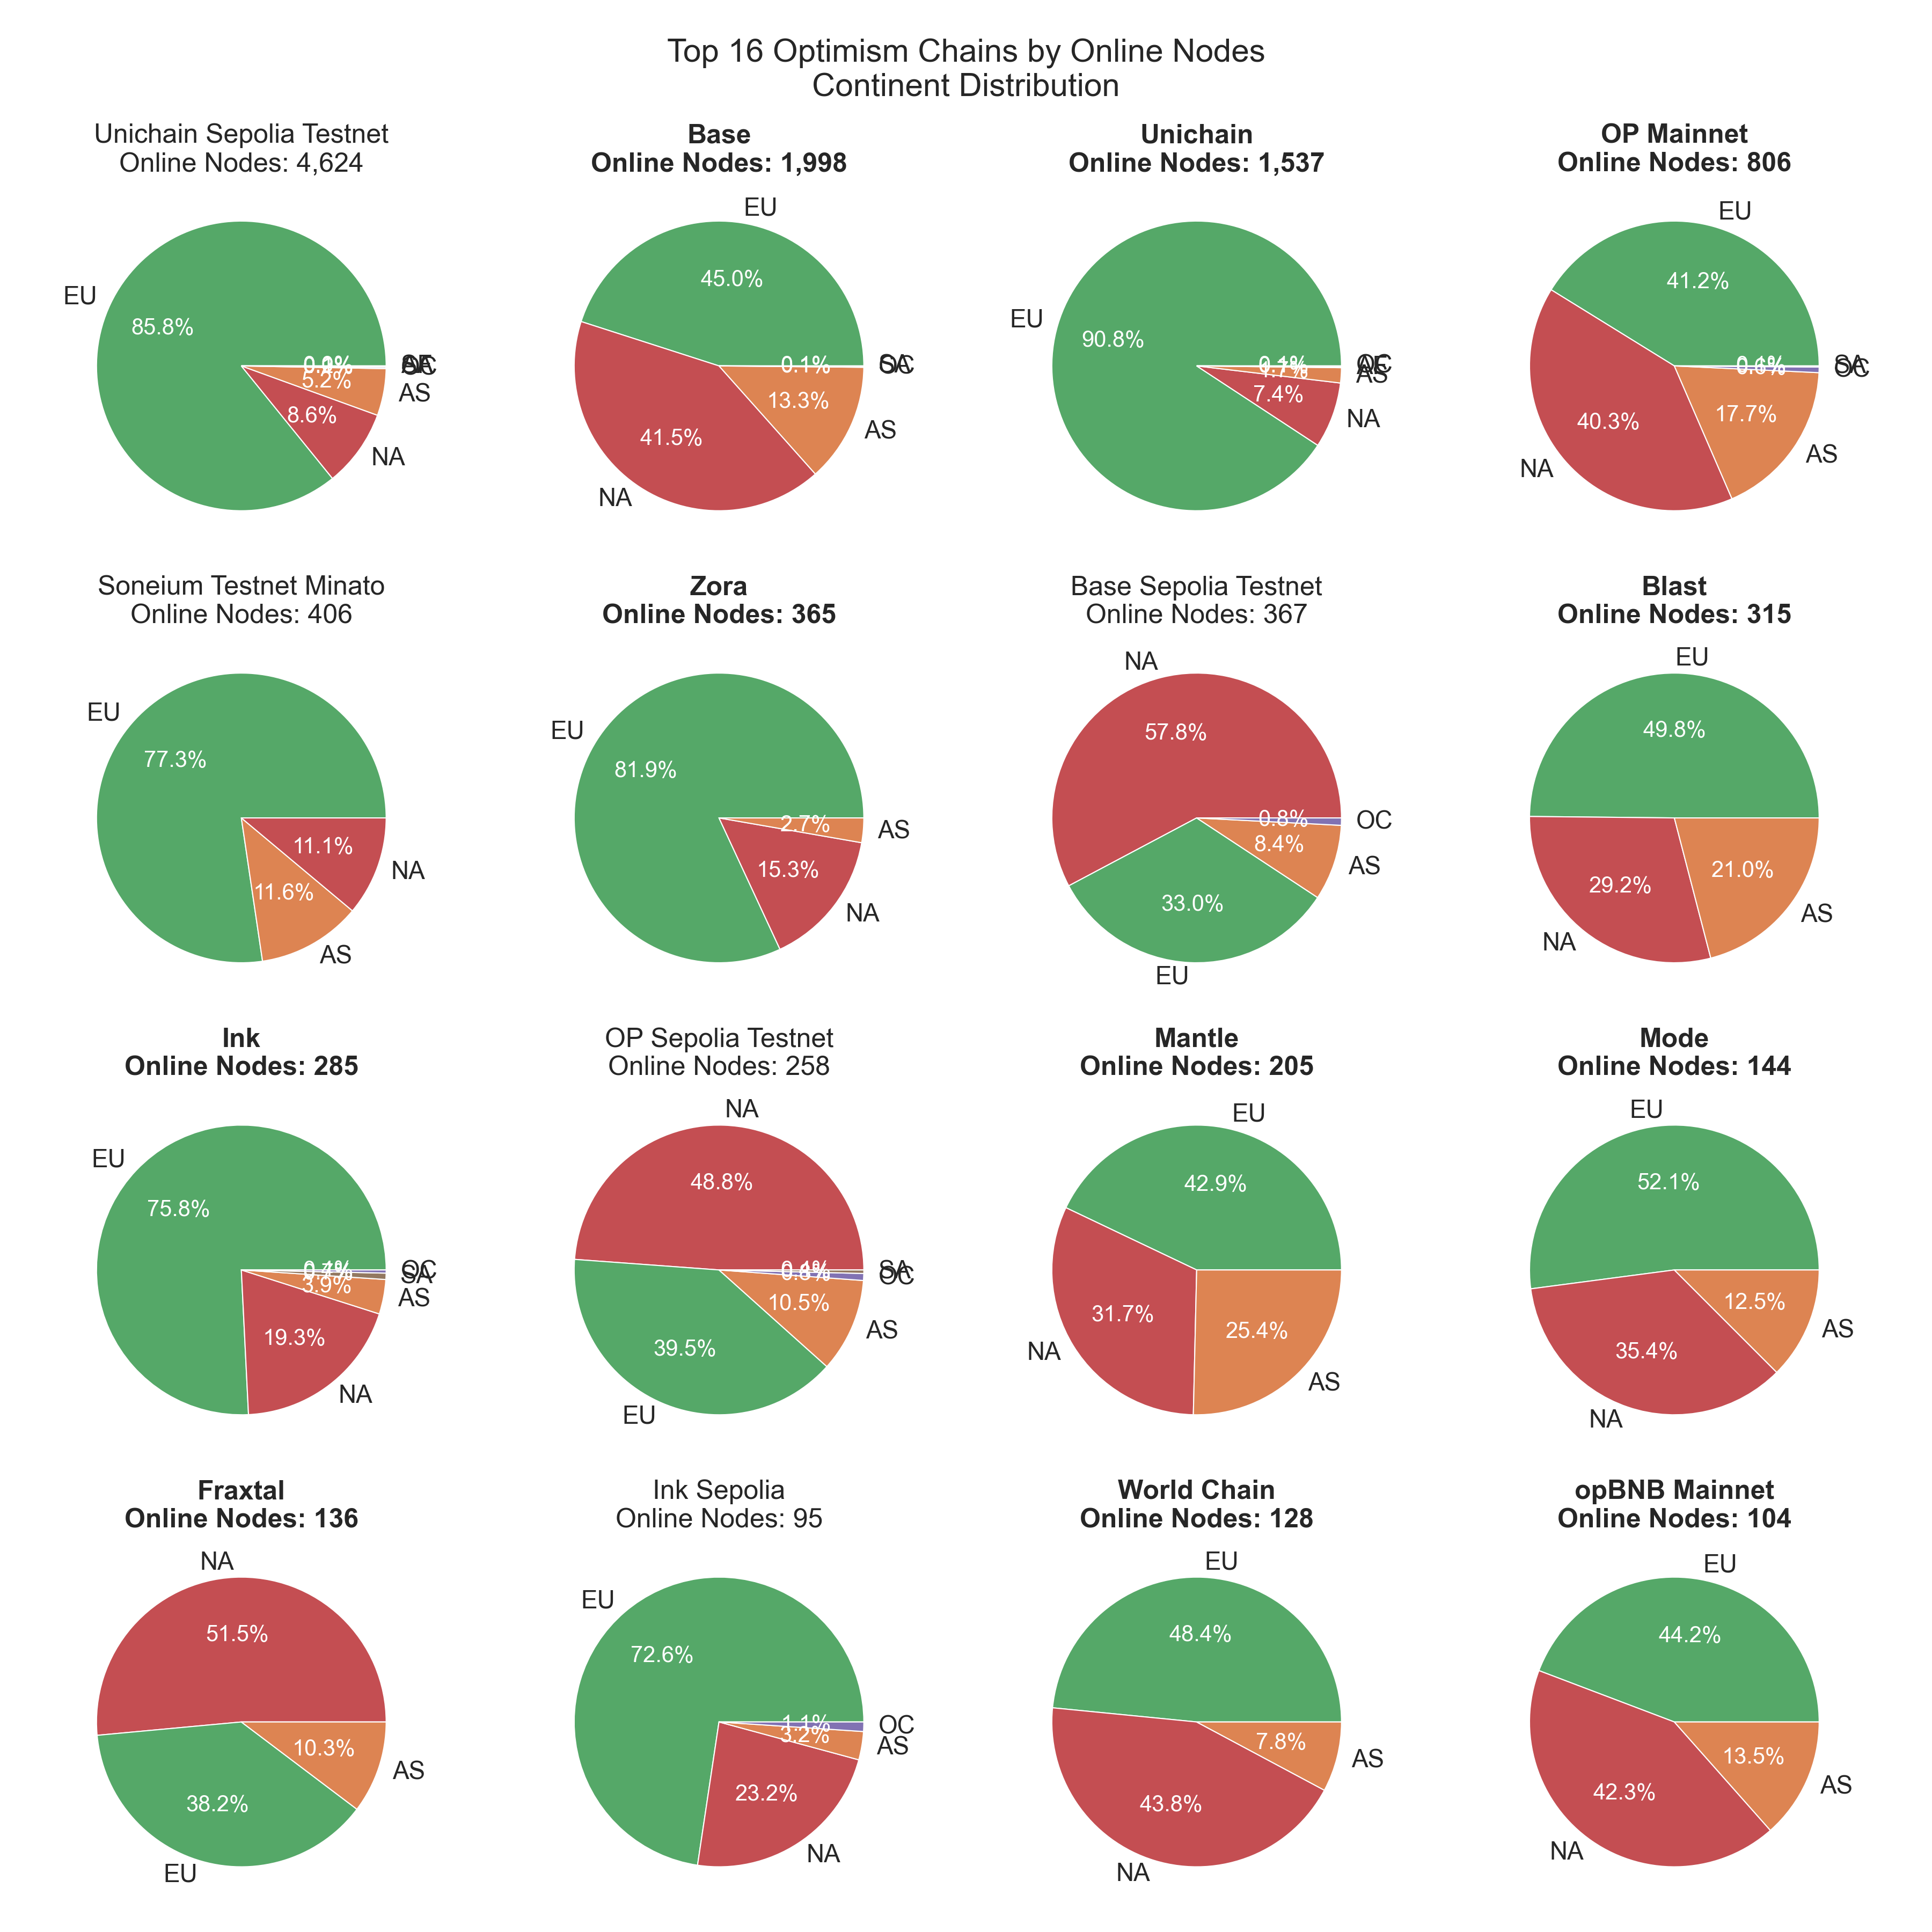
However, it’s worth noting that Germany is preferred primarily for testnet nodes, while when it comes to deploying mainnet nodes (those in bold in the graph below), US is the jurisdiction of preference (at least in terms of percentage points). This is apart from the Unichain mainnet, where we see most nodes deployed in Russia.

There is wider diversity when it comes to cloud providers for Superchain nodes with very few networks running more than 50% of their nodes in one cloud provider. It’s interesting to see, however, that there’s consistently less than 10% of nodes being ran in non-cloud infrastructure, with very few exceptions, namely, Base and Unichain having 10% and 15% of their nodes in non-cloud infra, respectively.
Finally (not presented here), we observed that consistently less than 10% of nodes (and normally close to 0%) run their nodes through a VPN connection.
We believe that checking in on such metrics on a regular basis helps keep visibility into the network structure and architecture, as well as the healthy state of the network.
For feedback on this post, or additional metrics that would be of interest to the community, feel free to reach out through the details listed in our contact page: https://probelab.network/contact.
You can find more of the results that our team is producing, as well as similar reports for other networks at: https://probelab.io.